The site visit still sees more
An IE on site can check pile depth, torque, wiring and workmanship. A count from above sees what is placed, and a contractor's number can turn out to be right.
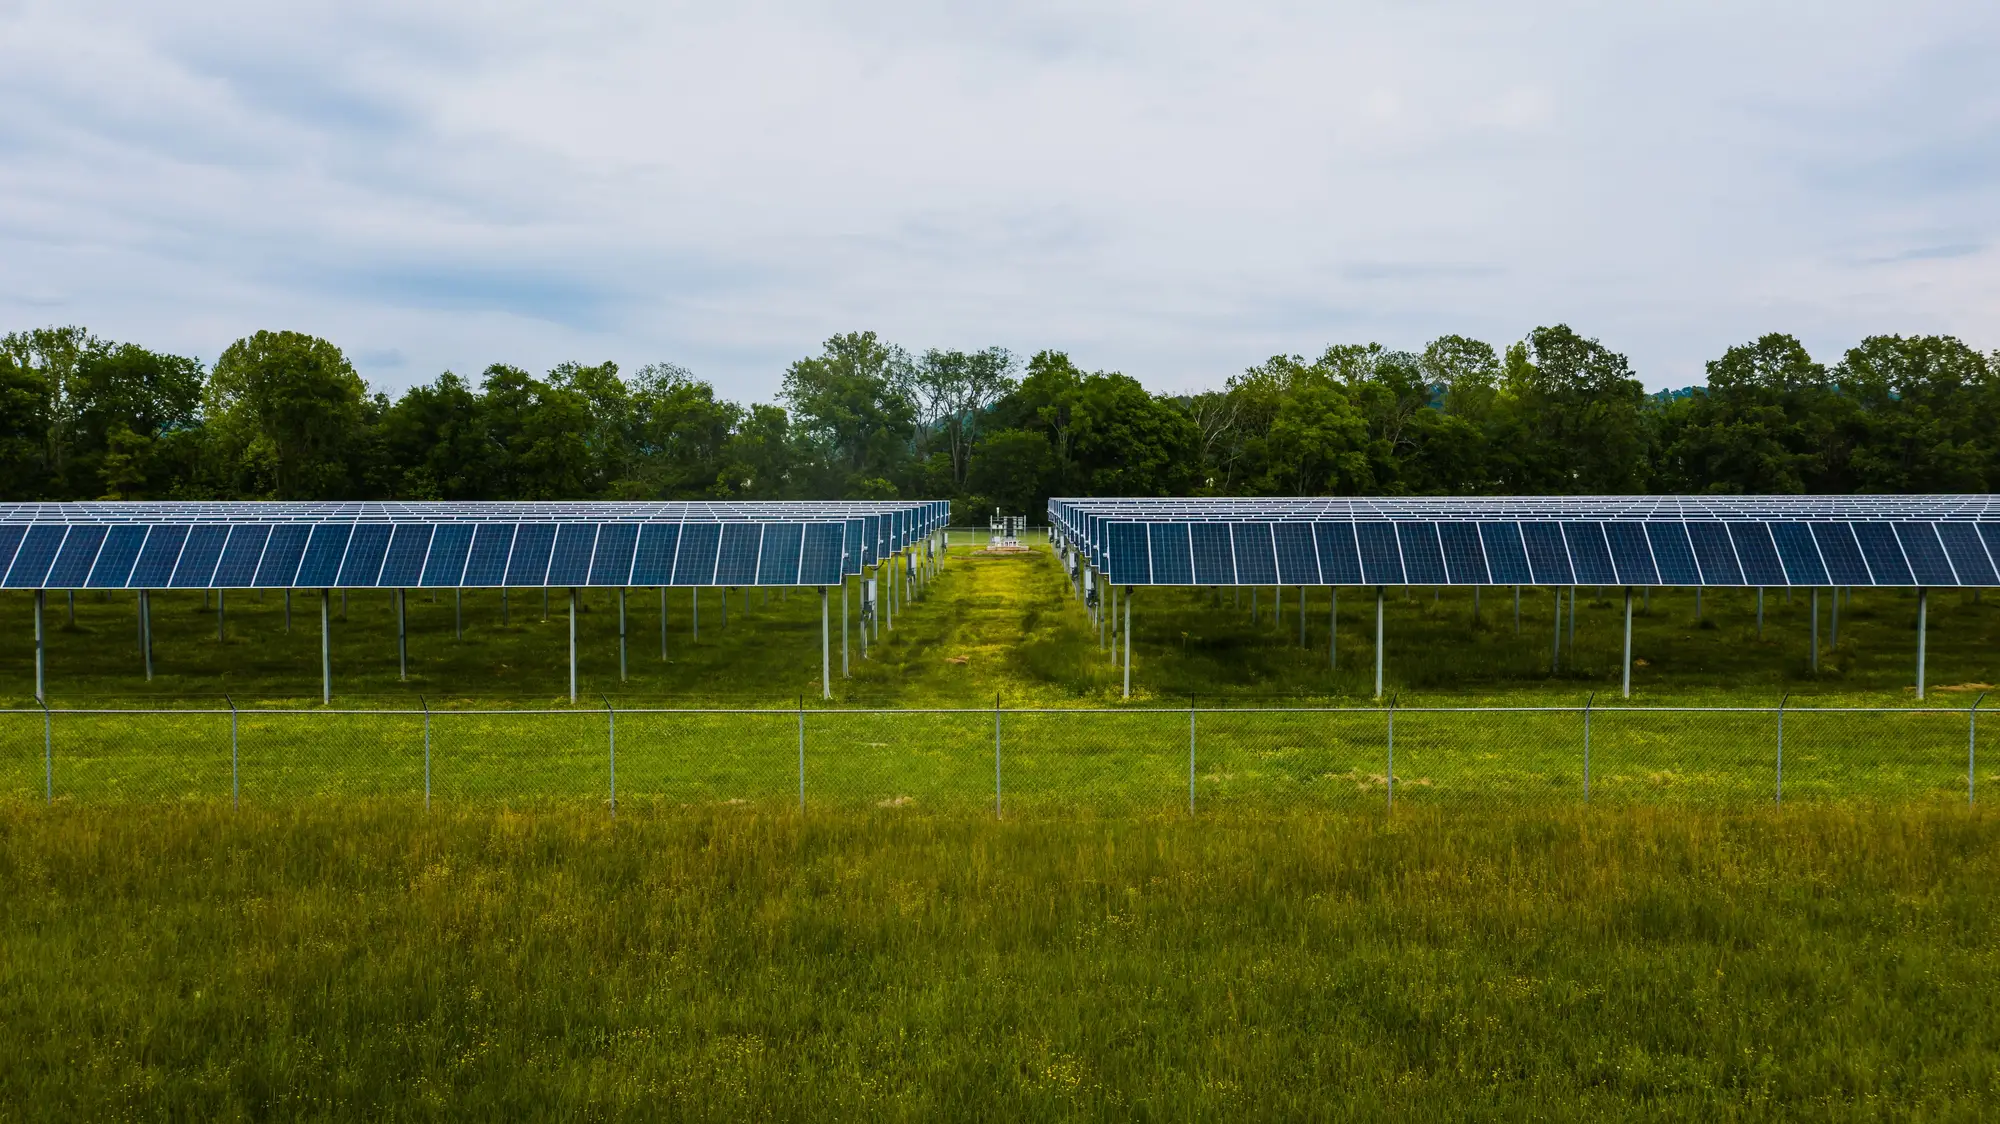
Solar Panel Counting counts modules, tables and inverters on a site from very-high-resolution imagery each quarter, so the number behind a draw request is one you did not get from the contractor.
The job today
A draw request lands with a percent-complete figure and a schedule of values. On your desk you have the EPC's monthly progress report, its photos, and the IE's certificate from the last visit. After the visit, the installed count is whatever the contractor's tracking sheet says.
Few visits walk every row of a utility-scale site, and the draw still has to be approved against a milestone in the loan agreement. You sign off on a number you cannot check from your chair, and the next look at the ground is weeks off.
| Step | The draw package today | With Solar Panel Counting |
|---|---|---|
| 01Reading the percent-installed | The draw package todayThe EPC reports a percent-installed in its monthly progress report, taken from its own tracking sheet. | With Solar Panel CountingYou get modules, tables and inverters counted from imagery, matched to the site layout, to set beside it. |
| 02Checking work in place between visits | The draw package todayContractor photos and the last IE visit stand in for the site until the next visit. | With Solar Panel CountingA quarterly count shows what is physically placed on the date of the image, block by block. |
| 03Tracking change since the last draw | The draw package todayYou compare this month's progress report with last month's, both written by the same party. | With Solar Panel CountingA quarter-over-quarter line shows the count added since the previous image. |
| 04Tying the count to the layout | The draw package todayThe percent is for the site as a whole, with no way to read it against table numbering. | With Solar Panel CountingCounts come back per table, matched to the layout you send, so a block that is behind stands out. |
| 05Putting a milestone in the draw file | The draw package todayThe milestone is tested against the EPC's say-so and the IE's certificate when it arrives. | With Solar Panel CountingThe count comes as a CSV with a dated imagery page, ready for the draw file ahead of sign-off. |
| Still yours | The draw decision, the IE's certificate and site visit, and any opinion on credit or on the quality of the work. | |
What you get
CSV
Modules counted per table and matched to your layout. This answers the first and fourth rows above. It opens in Excel or your portfolio system.
CSV
Inverters detected across the site and listed against the layout, so the inverter milestone has a number behind it.
Delta
The difference from the previous count, which is what you need for the since-the-last-draw row.
Ledger row 03
Imagery page
The image the count was made on, dated, to go in the draw file next to the progress report.
How it works
Send the site boundary and layout once. Each quarter we capture or pull a clear pass, count what is placed, and return the count against your layout in time for the next draw or the quarterly portfolio report.
The site boundary and your block, table and inverter numbering, as a drawing or a table reference.
A clear VHR pass over the site, satellite or aerial, at 0.3 m or finer.
Tables and inverters are detected in the image and modules are counted from the tables.
The count comes back matched to your layout, next to the milestone you are verifying.
Limits
An IE on site can check pile depth, torque, wiring and workmanship. A count from above sees what is placed, and a contractor's number can turn out to be right.
Optical imagery needs a clear pass. A cloudy window can push a quarter's count to the next one.
At 0.3 m a pixel is about a foot across, and a module takes only a few pixels. Tables and inverters are bigger targets than single modules. Modules are counted from the table layout and are not read one by one in every row.
The count reflects what the imagery shows placed. Modules stacked on pallets can read as installed ones from above unless they look different there.
Cracked modules, wiring faults and output cannot be seen and are not assessed.
FAQ
No. It gives the IE or the lender a counted number as one input. The certificate stays theirs.
It counts what the imagery shows placed. Staged inventory is only separated when it looks different from above.
A partly covered pass is flagged, and the count can move to the next window.
No. This is a count.
You send the layout or a table reference, and the count is matched to it.
Take a site your IE has already walked. Send the boundary and layout without the EPC's figures, and compare the count.
A CSV and an imagery page. We do not write into your portfolio system.
Ownership and licence terms are agreed in writing when you get started. If legal needs them earlier, ask.
By how many sites and what imagery is used. Tell us the sites and the draw schedule and we will scope it.
Send us a site layout and the milestone you are verifying. We will tell you what the imagery can show.